

 (Picture:
 Highcharts is, in my opinion, one of the best JavaScript libraries to work with data visualization and charts out there. Even though Highcharts is open source, it’s a commercial library. It’s free for use in non-commercial applications though.
In this tutorial we are going to explore how to integrate it with a Django project to render dynamically generated charts. In relation to drawing the charts and rendering it to the client, all the hard work is done by Highcharts at the client side. The configuration and setup is pure JavaScript.
The main challenge here is on how to translate the data from your backend to a format that Highcharts will understand. This data may come from a database or an external API, and probably is represented as Python objects (like in a QuerySet), or simply be represented as Python dictionaries or lists.
Generally speaking, there are two ways to do it:
- Via the request/response cycle, using Python and the Django template engine to write the JavaScript code directly in the template;
- Via an async request using AJAX, returning the data in JSON format.
The first option is like a brute force and in many cases the easiest way. The second option requires a slightly complicated setup, but you will also benefit from the page loading speed and from the maintainability of the code.
Installation / Setup
Basically we just need to include the Highcharts library in our template and we are ready to go. You can either download and serve it locally or simply use their CDN:
<script src="https://code.highcharts.com/highcharts.src.js"></script>Usage Scenario
Now we need some data. I thought that it would be fun to play with an existing dataset. The Titanic dataset is pretty famous one, and easy to access.
What I did here was loading the dataset (1300~ rows) into a model named Passenger:
class Passenger(models.Model):
    name = models.CharField()
    sex = models.CharField()
    survived = models.BooleanField()
    age = models.FloatField()
    ticket_class = models.PositiveSmallIntegerField()
    embarked = models.CharField()
If you are familiar with data mining, data science, or machine learning probably you already know this data set. This dataset is usually used for learning purpose. It’s composed by the list of passengers of the famous RMS Titanic tragedy.
We won’t be doing anything smart with it, just querying the database and displaying the data using Highcharts.
Highcharts Basics
I won’t dive into deep details about Highcharts. The goal is to understand how to make Django and Highcharts talk. For details about how to do this or that with Highcharts, best thing is to consult the official documentation.
Here is a working example of a column chart using Highcharts:
<!doctype html>
<html>
<head>
  <meta charset="utf-8">
  <title>Django Highcharts Example</title>
</head>
<body>
  <div id="container"></div>
  <script src="https://code.highcharts.com/highcharts.src.js"></script>
  <script>
    Highcharts.chart('container', {
        chart: {
            type: 'column'
        },
        title: {
            text: 'Historic World Population by Region'
        },
        xAxis: {
            categories: ['Africa', 'America', 'Asia', 'Europe', 'Oceania']
        },
        series: [{
            name: 'Year 1800',
            data: [107, 31, 635, 203, 2]
        }, {
            name: 'Year 1900',
            data: [133, 156, 947, 408, 6]
        }, {
            name: 'Year 2012',
            data: [1052, 954, 4250, 740, 38]
        }]
    });
  </script>
</body>
</html>
The code above generates the following chart:

The basic structure here is:
Highcharts.chart('id_of_the_container', {
  // dictionary of options/configuration
});
Basic Example
The most straightforward way to do it is by writing directly in the template (which is not recommended).
Let’s write an query to display the number of survivors and deaths organized by ticket class.
views.py
from django.db.models import Count, Q
from django.shortcuts import render
from .models import Passenger

def ticket_class_view(request):
    dataset = Passenger.objects \
        .values('ticket_class') \
        .annotate(survived_count=Count('ticket_class', filter=Q(survived=True)),
                  not_survived_count=Count('ticket_class', filter=Q(survived=False))) \
        .order_by('ticket_class')
    return render(request, 'ticket_class.html', {'dataset': dataset})
The queryset above generates a data in the following format:
[
  {'ticket_class': 1, 'survived_count': 200, 'not_survived_count': 123},
  {'ticket_class': 2, 'survived_count': 119, 'not_survived_count': 158},
  {'ticket_class': 3, 'survived_count': 181, 'not_survived_count': 528}
]
Then we could just write it in the template, inside the JavaScript tags:
ticket_class.html
<div id="container"></div>
<script src="https://code.highcharts.com/highcharts.src.js"></script>
<script>
  Highcharts.chart('container', {
      chart: {
          type: 'column'
      },
      title: {
          text: 'Titanic Survivors by Ticket Class'
      },
      xAxis: {
          categories: [
            {% for entry in dataset %}'{{ entry.ticket_class }} Class'{% if not forloop.last %}, {% endif %}{% endfor %}
          ]
      },
      series: [{
          name: 'Survived',
          data: [
            {% for entry in dataset %}{{ entry.survived_count }}{% if not forloop.last %}, {% endif %}{% endfor %}
          ],
          color: 'green'
      }, {
          name: 'Not survived',
          data: [
            {% for entry in dataset %}{{ entry.not_survived_count }}{% if not forloop.last %}, {% endif %}{% endfor %}
          ],
          color: 'red'
      }]
  });
</script>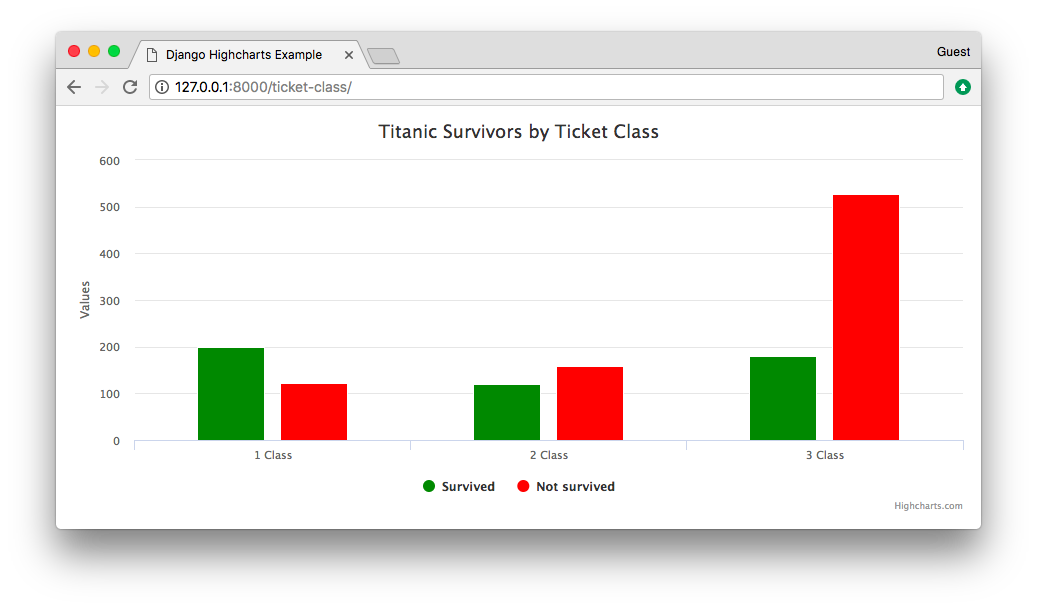
This kind of strategy is not really a good idea because the code is hard to read, hard to maintain and it is too easy
to shoot in the foot. Because we are using Python to generate JavaScript code, we have to format it properly.
For example, the code {% if not forloop.last %}, {% endif %} is to not append a comma (,) after
the last item of the array (otherwise the result would be [200, 119, 181,]). The newest JavaScript versions are
forgiving and accepts an extra comma (like Python does), but older versions don’t, so it might cause problem in old
browsers. Anyway, the point is you have to make sure your Python code is writing valid JavaScript code.
A slightly better way to do it would be processing the data a little bit more in the view:
views.py
import json
from django.db.models import Count, Q
from django.shortcuts import render
from .models import Passenger

def ticket_class_view_2(request):
    dataset = Passenger.objects \
        .values('ticket_class') \
        .annotate(survived_count=Count('ticket_class', filter=Q(survived=True)),
                  not_survived_count=Count('ticket_class', filter=Q(survived=False))) \
        .order_by('ticket_class')

    categories = list()
    survived_series = list()
    not_survived_series = list()

    for entry in dataset:
        categories.append('%s Class' % entry['ticket_class'])
        survived_series.append(entry['survived_count'])
        not_survived_series.append(entry['not_survived_count'])

    return render(request, 'ticket_class_2.html', {
        'categories': json.dumps(categories),
        'survived_series': json.dumps(survived_series),
        'not_survived_series': json.dumps(not_survived_series)
    })
ticket_class_2.html
<div id="container"></div>
<script src="https://code.highcharts.com/highcharts.src.js"></script>
<script>
  Highcharts.chart('container', {
      chart: {
          type: 'column'
      },
      title: {
          text: 'Titanic Survivors by Ticket Class'
      },
      xAxis: {
          categories: {{ categories|safe }}
      },
      series: [{
          name: 'Survived',
          data: {{ survived_series }},
          color: 'green'
      }, {
          name: 'Not survived',
          data: {{ not_survived_series }},
          color: 'red'
      }]
  });
</script>
Here’s what we are doing: first run through the queryset and create three separate lists, append the values and do the
formatting. After that, use the json module and dump the Python lists into JSON format. The result are Python strings
properly formatted as JSON data.
We have to use the safe template filter to properly render the categories because Django automatically escape
characters like ' and " for safety reason, so we have to instruct Django to trust and render it as it is.
We could also do all the configuration in the backend, like this:
views.py
import json
from django.db.models import Count, Q
from django.shortcuts import render
from .models import Passenger

def ticket_class_view_3(request):
    dataset = Passenger.objects \
        .values('ticket_class') \
        .annotate(survived_count=Count('ticket_class', filter=Q(survived=True)),
                  not_survived_count=Count('ticket_class', filter=Q(survived=False))) \
        .order_by('ticket_class')

    categories = list()
    survived_series_data = list()
    not_survived_series_data = list()

    for entry in dataset:
        categories.append('%s Class' % entry['ticket_class'])
        survived_series_data.append(entry['survived_count'])
        not_survived_series_data.append(entry['not_survived_count'])

    survived_series = {
        'name': 'Survived',
        'data': survived_series_data,
        'color': 'green'
    }

    not_survived_series = {
        'name': 'Survived',
        'data': not_survived_series_data,
        'color': 'red'
    }

    chart = {
        'chart': {'type': 'column'},
        'title': {'text': 'Titanic Survivors by Ticket Class'},
        'xAxis': {'categories': categories},
        'series': [survived_series, not_survived_series]
    }

    dump = json.dumps(chart)

    return render(request, 'ticket_class_3.html', {'chart': dump})
ticket_class_3.html
<div id="container"></div>
<script src="https://code.highcharts.com/highcharts.src.js"></script>
<script>
  Highcharts.chart('container', {{ chart|safe }});
</script>
As you can see, that way we move all the configuration to the server side. But we are still interacting with the JavaScript code directly.
JSON Example
Now this is how I usually like to work with Highcharts (or any other JavaScript library that interacts with the server).
The idea here is to render the chart using an asynchronous call, returning a JsonResponse from the server.
This time, we are going to need two routes:
urls.py
from django.urls import path

from passengers import views

urlpatterns = [
    path('json-example/', views.json_example, name='json_example'),
    path('json-example/data/', views.chart_data, name='chart_data'),
]
The json_example URL route is pointing to a regular view, which will render the template which will invoke the
chart_data view. This call can be automatic upon page load, or it can be triggered by an action (a button click
for example).
views.py
def json_example(request):
return render(request, 'json_example.html')
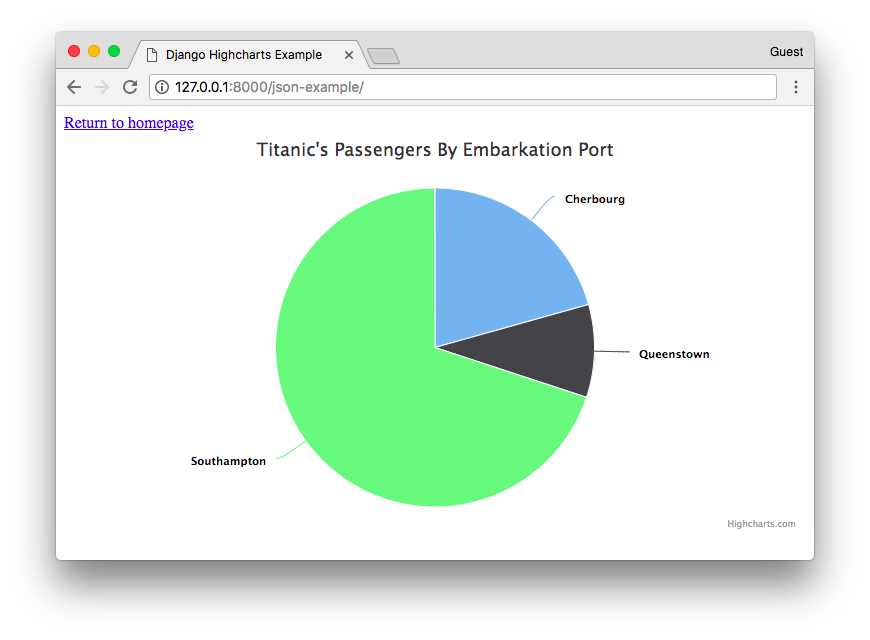
def chart_data(request):
dataset = Passenger.objects \
.values('embarked') \
.exclude(embarked='') \
.annotate(total=Count('embarked')) \
.order_by('embarked')
port_display_name = dict()
for port_tuple in Passenger.PORT_CHOICES:
port_display_name[port_tuple[0]] = port_tuple[1]
chart = {
'chart': {'type': 'pie'},
'title': {'text': 'Titanic Survivors by Ticket Class'},
'series': [{
'name': 'Embarkation Port',
'data': list(map(lambda row: {'name': port_display_name[row['embarked']], 'y': row['total']}, dataset))
}]
}
return JsonResponse(chart)Here we can see the json_example is nothing special, just returning the json_example.html template, which we are
going to explore in a minute.
The chart_data is the one doing all the hard work. Here we have the database query and building the chart
dictionary. In the end we return the chart data as a JSON object.
json_example.html
<!doctype html>
<html>
<head>
  <meta charset="utf-8">
  <title>Django Highcharts Example</title>
</head>
<body>
  <div id="container" data-url="{% url 'chart_data' %}"></div>
  <script src="https://code.highcharts.com/highcharts.src.js"></script>
  <script src="https://code.jquery.com/jquery-3.3.1.min.js"></script>
  <script>
    $.ajax({
      url: $("#container").attr("data-url"),
      dataType: 'json',
      success: function (data) {
        Highcharts.chart("container", data);
      }
    });
  </script>
</body>
</html>
Here is where the magic happens. The div with id container is where the chart is going to be rendered. Now, observe
that I included a custom attribute named data-url. Inside this attribute I stored the path to the view that will be
used to load the chart data.
Inside the ajax call, we make the request based on the URL provided in the data-url and instruct the ajax request
that we are expecting a JSON object in return (defined by the dataType). When the request completes, the JSON
response will be inside the data parameter in the success function. Finally, inside the success function, we
render the chart using the Highcharts API.
This is extremely useful because now we can decouple all the JavaScript from our template. In this example we used a single file for simplicity, but nothing stops us now from saving the script tag content in a separate file. This is great because we are no longer mixing the Django template language with JavaScript.
The result is the following screen shot:
Conclusions
In this tutorial we explored the basics on how to integrate Highcharts.js with Django. The implementation concepts used in this tutorial can be applied in other charts libraries such as Charts.js. The process should be very similar.
Whenever possible, try to avoid interacting with JavaScript code using the Django Template Language. Prefer returning the data as JSON objects already processed and ready to use.
Usually when working with charts and data visualization the most challenging part is to squeeze the data in the format required to render the chart. What I usually do is first create a static example hardcoding the data so I can have an idea about the data format. Next, I start creating the QuerySet using in the Python terminal. After I get it right, I finally write the view function.
If you want to learn more, the best way is to get your hands dirty. Here’s something you can do:
- First study the format of the data by checking the titanic.csv file;
- Then examine the Passenger model class;
- Go to the Highcharts.js demo page and find a chart you want to implement;
- Clone the django-highcharts-example repository on GitHub and implement it.
 How to Use Chart.js with Django
 How to Implement Dependent/Chained Dropdown List with Django
 How to Create Infinite Scroll With Django
 How to Extend Django User Model
 How to Setup a SSL Certificate on Nginx for a Django Application
 How to Deploy a Django Application to Digital Ocean