

 (Picture:
 Chart.js is a cool open source JavaScript library that helps you render HTML5 charts. It is responsive and counts with 8 different chart types.
In this tutorial we are going to explore a little bit of how to make Django talk with Chart.js and render some simple charts based on data extracted from our models.
Installation
For this tutorial all you are going to do is add the Chart.js lib to your HTML page:
<script src="https://cdn.jsdelivr.net/npm/chart.js@2.9.3/dist/Chart.min.js"></script>You can download it from Chart.js official website and use it locally, or you can use it from a CDN using the URL above.
Example Scenario
I’m going to use the same example I used for the tutorial How to Create Group By Queries With Django ORM which is a good complement to this tutorial because actually the tricky part of working with charts is to transform the data so it can fit in a bar chart / line chart / etc.
We are going to use the two models below, Country and City:
class Country(models.Model):
    name = models.CharField(max_length=30)

class City(models.Model):
    name = models.CharField(max_length=30)
    country = models.ForeignKey(Country, on_delete=models.CASCADE)
    population = models.PositiveIntegerField()
And the raw data stored in the database:
| cities | |||
|---|---|---|---|
| id | name | country_id | population |
| 1 | Tokyo | 28 | 36,923,000 |
| 2 | Shanghai | 13 | 34,000,000 |
| 3 | Jakarta | 19 | 30,000,000 |
| 4 | Seoul | 21 | 25,514,000 |
| 5 | Guangzhou | 13 | 25,000,000 |
| 6 | Beijing | 13 | 24,900,000 |
| 7 | Karachi | 22 | 24,300,000 |
| 8 | Shenzhen | 13 | 23,300,000 |
| 9 | Delhi | 25 | 21,753,486 |
| 10 | Mexico City | 24 | 21,339,781 |
| 11 | Lagos | 9 | 21,000,000 |
| 12 | São Paulo | 1 | 20,935,204 |
| 13 | Mumbai | 25 | 20,748,395 |
| 14 | New York City | 20 | 20,092,883 |
| 15 | Osaka | 28 | 19,342,000 |
| 16 | Wuhan | 13 | 19,000,000 |
| 17 | Chengdu | 13 | 18,100,000 |
| 18 | Dhaka | 4 | 17,151,925 |
| 19 | Chongqing | 13 | 17,000,000 |
| 20 | Tianjin | 13 | 15,400,000 |
| 21 | Kolkata | 25 | 14,617,882 |
| 22 | Tehran | 11 | 14,595,904 |
| 23 | Istanbul | 2 | 14,377,018 |
| 24 | London | 26 | 14,031,830 |
| 25 | Hangzhou | 13 | 13,400,000 |
| 26 | Los Angeles | 20 | 13,262,220 |
| 27 | Buenos Aires | 8 | 13,074,000 |
| 28 | Xi'an | 13 | 12,900,000 |
| 29 | Paris | 6 | 12,405,426 |
| 30 | Changzhou | 13 | 12,400,000 |
| 31 | Shantou | 13 | 12,000,000 |
| 32 | Rio de Janeiro | 1 | 11,973,505 |
| 33 | Manila | 18 | 11,855,975 |
| 34 | Nanjing | 13 | 11,700,000 |
| 35 | Rhine-Ruhr | 16 | 11,470,000 |
| 36 | Jinan | 13 | 11,000,000 |
| 37 | Bangalore | 25 | 10,576,167 |
| 38 | Harbin | 13 | 10,500,000 |
| 39 | Lima | 7 | 9,886,647 |
| 40 | Zhengzhou | 13 | 9,700,000 |
| 41 | Qingdao | 13 | 9,600,000 |
| 42 | Chicago | 20 | 9,554,598 |
| 43 | Nagoya | 28 | 9,107,000 |
| 44 | Chennai | 25 | 8,917,749 |
| 45 | Bangkok | 15 | 8,305,218 |
| 46 | Bogotá | 27 | 7,878,783 |
| 47 | Hyderabad | 25 | 7,749,334 |
| 48 | Shenyang | 13 | 7,700,000 |
| 49 | Wenzhou | 13 | 7,600,000 |
| 50 | Nanchang | 13 | 7,400,000 |
| 51 | Hong Kong | 13 | 7,298,600 |
| 52 | Taipei | 29 | 7,045,488 |
| 53 | Dallas–Fort Worth | 20 | 6,954,330 |
| 54 | Santiago | 14 | 6,683,852 |
| 55 | Luanda | 23 | 6,542,944 |
| 56 | Houston | 20 | 6,490,180 |
| 57 | Madrid | 17 | 6,378,297 |
| 58 | Ahmedabad | 25 | 6,352,254 |
| 59 | Toronto | 5 | 6,055,724 |
| 60 | Philadelphia | 20 | 6,051,170 |
| 61 | Washington, D.C. | 20 | 6,033,737 |
| 62 | Miami | 20 | 5,929,819 |
| 63 | Belo Horizonte | 1 | 5,767,414 |
| 64 | Atlanta | 20 | 5,614,323 |
| 65 | Singapore | 12 | 5,535,000 |
| 66 | Barcelona | 17 | 5,445,616 |
| 67 | Munich | 16 | 5,203,738 |
| 68 | Stuttgart | 16 | 5,200,000 |
| 69 | Ankara | 2 | 5,150,072 |
| 70 | Hamburg | 16 | 5,100,000 |
| 71 | Pune | 25 | 5,049,968 |
| 72 | Berlin | 16 | 5,005,216 |
| 73 | Guadalajara | 24 | 4,796,050 |
| 74 | Boston | 20 | 4,732,161 |
| 75 | Sydney | 10 | 5,000,500 |
| 76 | San Francisco | 20 | 4,594,060 |
| 77 | Surat | 25 | 4,585,367 |
| 78 | Phoenix | 20 | 4,489,109 |
| 79 | Monterrey | 24 | 4,477,614 |
| 80 | Inland Empire | 20 | 4,441,890 |
| 81 | Rome | 3 | 4,321,244 |
| 82 | Detroit | 20 | 4,296,611 |
| 83 | Milan | 3 | 4,267,946 |
| 84 | Melbourne | 10 | 4,650,000 |
| countries | |
|---|---|
| id | name |
| 1 | Brazil |
| 2 | Turkey |
| 3 | Italy |
| 4 | Bangladesh |
| 5 | Canada |
| 6 | France |
| 7 | Peru |
| 8 | Argentina |
| 9 | Nigeria |
| 10 | Australia |
| 11 | Iran |
| 12 | Singapore |
| 13 | China |
| 14 | Chile |
| 15 | Thailand |
| 16 | Germany |
| 17 | Spain |
| 18 | Philippines |
| 19 | Indonesia |
| 20 | United States |
| 21 | South Korea |
| 22 | Pakistan |
| 23 | Angola |
| 24 | Mexico |
| 25 | India |
| 26 | United Kingdom |
| 27 | Colombia |
| 28 | Japan |
| 29 | Taiwan |
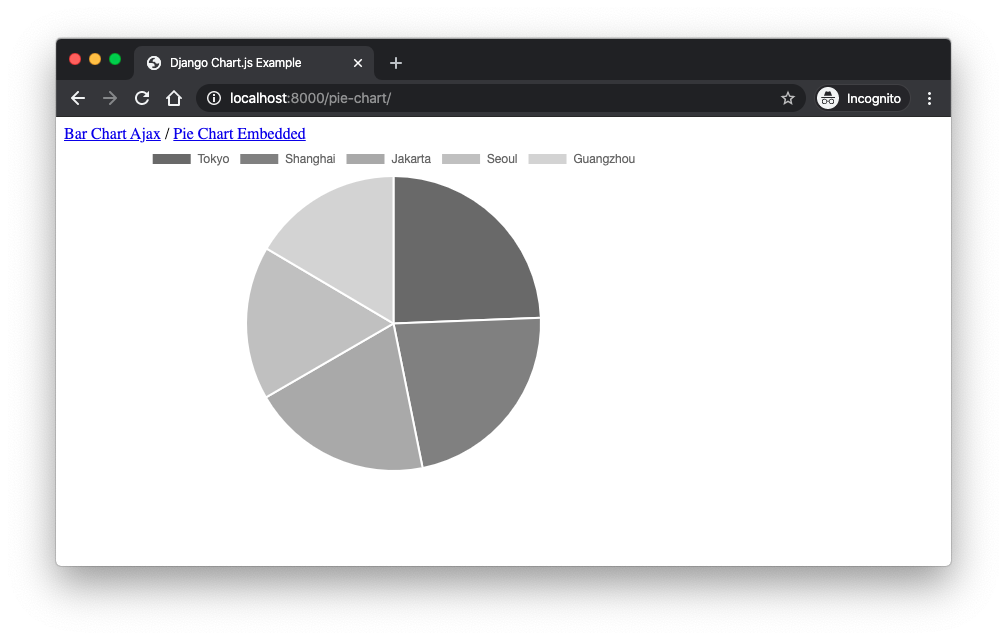
Example 1: Pie Chart
For the first example we are only going to retrieve the top 5 most populous cities and render it as a pie chart. In this strategy we are going to return the chart data as part of the view context and inject the results in the JavaScript code using the Django Template language.
views.py
from django.shortcuts import render
from mysite.core.models import City

def pie_chart(request):
    labels = []
    data = []

    queryset = City.objects.order_by('-population')[:5]
    for city in queryset:
        labels.append(city.name)
        data.append(city.population)

    return render(request, 'pie_chart.html', {
        'labels': labels,
        'data': data,
    })
Basically in the view above we are iterating through the City queryset and building a list of labels and a list of
data. Here in this case the data is the population count saved in the City model.
For the urls.py just a simple routing:
urls.py
from django.urls import path
from mysite.core import views

urlpatterns = [
    path('pie-chart/', views.pie_chart, name='pie-chart'),
]
Now the template. I got a basic snippet from the Chart.js Pie Chart Documentation.
pie_chart.html
{% extends 'base.html' %}

{% block content %}
  <div id="container" style="width: 75%;">
    <canvas id="pie-chart"></canvas>
  </div>

  <script src="https://cdn.jsdelivr.net/npm/chart.js@2.9.3/dist/Chart.min.js"></script>
  <script>

    var config = {
      type: 'pie',
      data: {
        datasets: [{
          data: {{ data|safe }},
          backgroundColor: [
            '#696969', '#808080', '#A9A9A9', '#C0C0C0', '#D3D3D3'
          ],
          label: 'Population'
        }],
        labels: {{ labels|safe }}
      },
      options: {
        responsive: true
      }
    };

    window.onload = function() {
      var ctx = document.getElementById('pie-chart').getContext('2d');
      window.myPie = new Chart(ctx, config);
    };

  </script>

{% endblock %}
In the example above the base.html template is not important but you can see it in the code example I shared in the
end of this post.
This strategy is not ideal but works fine. The bad thing is that we are using the Django Template Language to interfere
with the JavaScript logic. When we put {{ data|safe}} we are injecting a variable that came from
the server directly in the JavaScript code.
The code above looks like this:
Example 2: Bar Chart with Ajax
As the title says, we are now going to render a bar chart using an async call.
views.py
from django.shortcuts import render
from django.db.models import Sum
from django.http import JsonResponse
from mysite.core.models import City

def home(request):
    return render(request, 'home.html')

def population_chart(request):
    labels = []
    data = []

    queryset = City.objects.values('country__name').annotate(country_population=Sum('population')).order_by('-country_population')
    for entry in queryset:
        labels.append(entry['country__name'])
        data.append(entry['country_population'])

    return JsonResponse(data={
        'labels': labels,
        'data': data,
    })
So here we are using two views. The home view would be the main page where the chart would be loaded at. The other
view population_chart would be the one with the sole responsibility to aggregate the data the return a JSON response
with the labels and data.
If you are wondering about what this queryset is doing, it is grouping the cities by the country and aggregating the total population of each country. The result is going to be a list of country + total population. To learn more about this kind of query have a look on this post: How to Create Group By Queries With Django ORM
urls.py
from django.urls import path
from mysite.core import views

urlpatterns = [
    path('', views.home, name='home'),
    path('population-chart/', views.population_chart, name='population-chart'),
]
home.html
{% extends 'base.html' %}

{% block content %}

  <div id="container" style="width: 75%;">
    <canvas id="population-chart" data-url="{% url 'population-chart' %}"></canvas>
  </div>

  <script src="https://code.jquery.com/jquery-3.4.1.min.js"></script>
  <script src="https://cdn.jsdelivr.net/npm/chart.js@2.9.3/dist/Chart.min.js"></script>
  <script>

    $(function () {

      var $populationChart = $("#population-chart");
      $.ajax({
        url: $populationChart.data("url"),
        success: function (data) {

          var ctx = $populationChart[0].getContext("2d");

          new Chart(ctx, {
            type: 'bar',
            data: {
              labels: data.labels,
              datasets: [{
                label: 'Population',
                backgroundColor: 'blue',
                data: data.data
              }]
            },
            options: {
              responsive: true,
              legend: {
                position: 'top',
              },
              title: {
                display: true,
                text: 'Population Bar Chart'
              }
            }
          });

        }
      });

    });

  </script>

{% endblock %}
Now we have a better separation of concerns. Looking at the chart container:
<canvas id="population-chart" data-url="{% url 'population-chart' %}"></canvas>We added a reference to the URL that holds the chart rendering logic. Later on we are using it to execute the Ajax call.
var $populationChart = $("#population-chart");
$.ajax({
  url: $populationChart.data("url"),
  success: function (data) {
    // ...
  }
});
Inside the success callback we then finally execute the Chart.js related code using the JsonResponse data.

Conclusions
I hope this tutorial helped you to get started with working with charts using Chart.js. I published another tutorial on the same subject a while ago but using the Highcharts library. The approach is pretty much the same: How to Integrate Highcharts.js with Django.
If you want to grab the code I used in this tutorial you can find it here: github.com/sibtc/django-chartjs-example.
 How to Integrate Highcharts.js with Django
 How to Extend Django User Model
 How to Setup a SSL Certificate on Nginx for a Django Application
 How to Deploy a Django Application to Digital Ocean